Facts and statistics may sometimes become hard to imagine. We might not understand the complicity of the thinning ice layer, or enlarging ozone hole when it seems to be an abstract concept – something very far away and incomprehensible.
Facts and statistics may sometimes become hard to imagine. We might not understand the complicity of the thinning ice layer, or enlarging ozone hole when it seems to be an abstract concept – something very far away and incomprehensible.
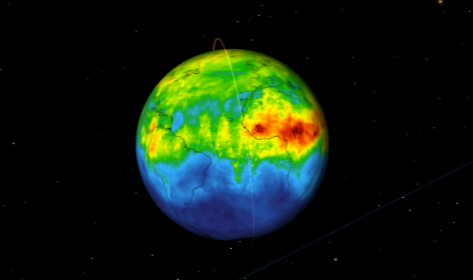
NASA has created a tool, that uses multiple data collected on Earth and around it to create a dedicated climate change website. There you can find both the globe’s overview, it’s vital signs such as the most up-to-date state of sea levels, ozone layer, carbon dioxide or temperature. All of this is presented in a way that may help us imagine the scale of the problem: it’s shown on a 3D model of our own Earth.
The database provides also updates on statistics, such as the growing Earth’s temperature or the latest news. You can find out more here.

The source is linked here.


